Xenium in situ data analysis services
Subcellular transcripts, single-cell resolution, and segmentation errors that can quietly create fake biology. We fix segmentation first, then answer your questions.
In short
OmicsQuest analyzes 10x Genomics Xenium (Xenium v1, Xenium Prime 5K and multimodal cell segmentation) data from the onboard Xenium Ranger outputs. We assess transcript quality (Q-scores, negative controls), evaluate and improve cell segmentation with Baysor, Proseg or Cellpose, annotate cells with reference mapping, and analyze neighborhoods, cellular niches, spatial gradients and multi-sample differences. We also help design custom panels. Pricing starts at $79/hour.
Publication-quality figures
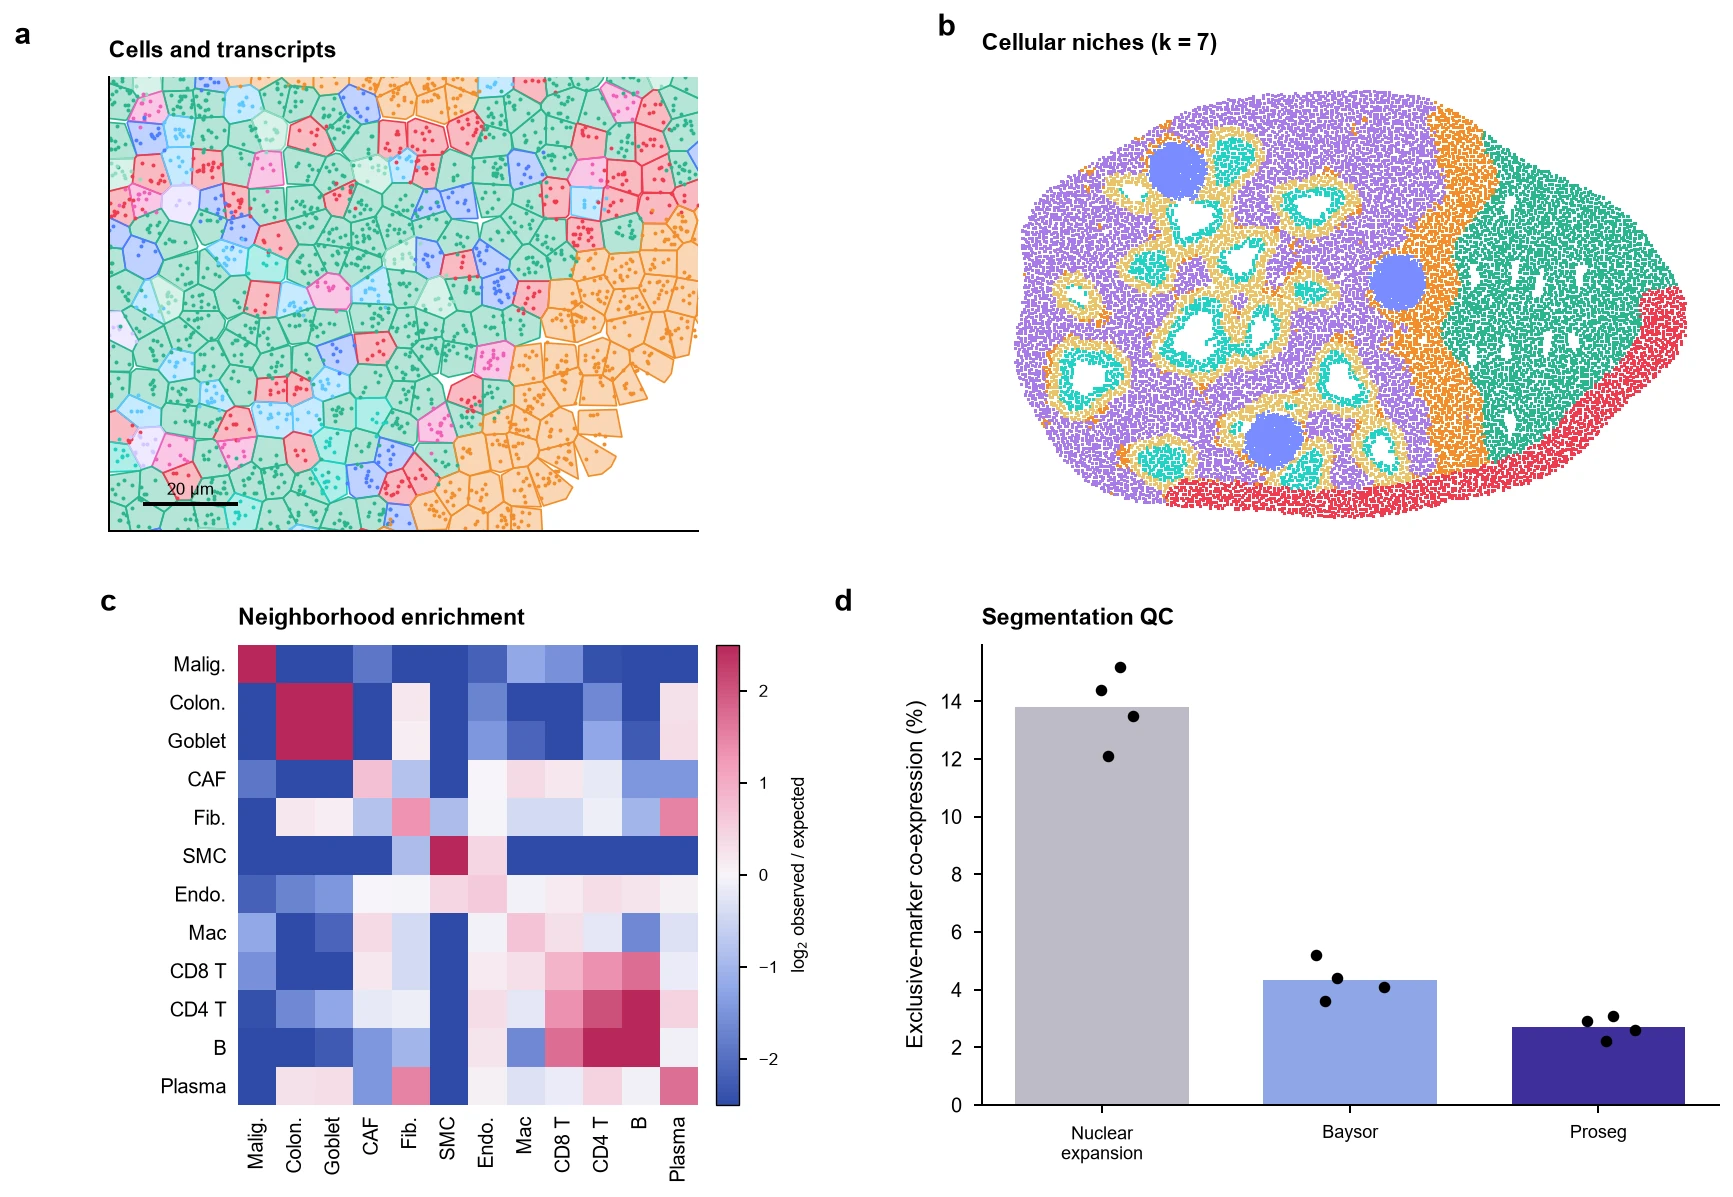
The kind of multi-panel figure we deliver, styled to journal specifications and revised until it is right.
Xenium in situ analysis: analyses we run
Every analysis below is available from raw data or from your processed files. Pick the ones your question needs; we recommend a robust core set during scoping.
Transcript and run QC
- Transcript quality filtering
- Q-score thresholds and negative-control probe and codeword rates per region.
- Tissue and region QC
- Detection efficiency across the slide, edge effects and damaged areas.
- Panel performance
- Per-gene detection versus expected expression from scRNA-seq references.
Cell segmentation
- Segmentation evaluation
- Doublet-like co-expression of mutually exclusive markers as a direct segmentation error metric.
- Re-segmentation
- Baysor, Proseg, Cellpose with membrane stains, or Xenium Ranger resegment with tuned nuclear expansion.
- Transcript assignment cleanup
- Remove spillover transcripts at cell borders before downstream statistics.
Cell identity
- Reference-based annotation
- Label transfer from matched or atlas scRNA-seq with gene-panel-aware methods.
- Panel-limited clustering
- Clustering tuned for 300-5,000 genes, with marker validation.
- Subcellular localization
- Nuclear versus cytoplasmic transcript distributions per gene and cell type.
Spatial organization
- Neighborhood and niche analysis
- Cellular neighborhoods, niche composition and co-localization statistics.
- Distance and gradient analysis
- Expression and composition as a function of distance to structures (vessels, tumor border, crypt base).
- Multi-sample comparison
- Replicate-aware comparison of cell type abundance and niche composition.
- Spatial ligand-receptor analysis
- Contact-dependent and short-range signaling restricted to neighbors.
Design support
- Custom panel design
- Gene selection from your scRNA-seq to separate the cell states you care about.
- Platform integration
- Combine Xenium with Visium HD, H&E or scRNA-seq on serial sections.
What you receive
- Transcript and segmentation QC report
- Re-segmented, annotated SpatialData objects
- Xenium Explorer-compatible outputs
- Niche, gradient and comparison figures
- Methods and code
Mistakes our experts avoid
- Trusting default segmentation everywhereNucleus expansion works poorly in dense or irregular tissue, so neighboring transcripts get assigned to the wrong cell. That creates fake co-expression and fake ligand-receptor pairs. We measure the error and re-segment.
- Ignoring negative controlsBackground codewords tell you the false detection rate in each region. We filter low-quality transcripts and report background.
- Clustering on a biased panelA 300-gene panel designed for immune cells will over-split immune cells and merge everything else. We annotate with panel-aware references.
- Calling a cell type absentIf a panel lacks its markers, a cell type cannot be detected. We report which populations the panel can and cannot resolve.
Tools and methods
We choose methods for your design, benchmark where it matters, and document versions for reproducibility.
- Xenium Ranger
- Xenium Explorer
- SpatialData
- Baysor
- Proseg
- Cellpose
- Squidpy
- scvi-tools
- RCTD
- CellCharter
How a project runs
Scoping call
Thirty minutes, free. We learn the biology, the design and the deadline.
Capped estimate
A written plan with hours, deliverables and a cap. No surprise invoices.
Secure transfer and QC
Encrypted transfer, then a QC report and a go/no-go call within days.
Analysis with check-ins
Weekly calls with your duo team and interim figures you can steer.
Figures, methods, code
Publication-quality figures, methods text and reproducible code. Revisions are unlimited.
Projects we rescued
Frequently asked questions
Should I re-segment my Xenium data?
Often, yes. Re-segmentation helps most in dense tissue (lymphoid organs, tumors, brain) and wherever neighboring cell types have exclusive markers. We first measure how much the default segmentation mixes cells, then decide.
Can you help design a Xenium custom panel?
Yes. We select genes from your single-cell data, or public atlases, that best separate your cell states, and we check for optical crowding from very highly expressed genes.
Xenium or Visium HD: which should I choose?
Xenium gives true single-cell, subcellular resolution for a targeted panel. Visium HD gives the whole transcriptome at 2 µm bins. Our comparison guide covers when each one wins.
Further reading
Send us your Xenium in situ data question.
Send a few lines about your experiment. A bioinformatician and a biologist will review it and reply with questions or a capped estimate. Analysis starts at $79/hour, and figure customization is unlimited.
- Free 30-minute scoping call
- Capped estimate before any billable work
- You own all data, code, figures and IP
Prefer email? contact@omicsquest.com