Single-cell RNA-seq analysis services
From raw FASTQ files to annotated cell states, statistically sound differential expression and publication-ready figures. A bioinformatician and a cell biologist work on every scRNA-seq and snRNA-seq project.
In short
OmicsQuest analyzes single-cell and single-nucleus RNA-seq data (10x Genomics Chromium, Parse Evercode, Scale Bio, BD Rhapsody, Smart-seq and others) from FASTQ or count matrices. Every project includes ambient RNA and doublet removal, sample-aware integration, expert cell-type annotation checked by a biologist, and pseudobulk differential expression that respects biological replicates. You get publication-quality figures and a methods section. Billing is hourly from $79/hour, figure revisions are unlimited, and a QC report usually arrives within 3 to 5 business days.
Publication-quality figures
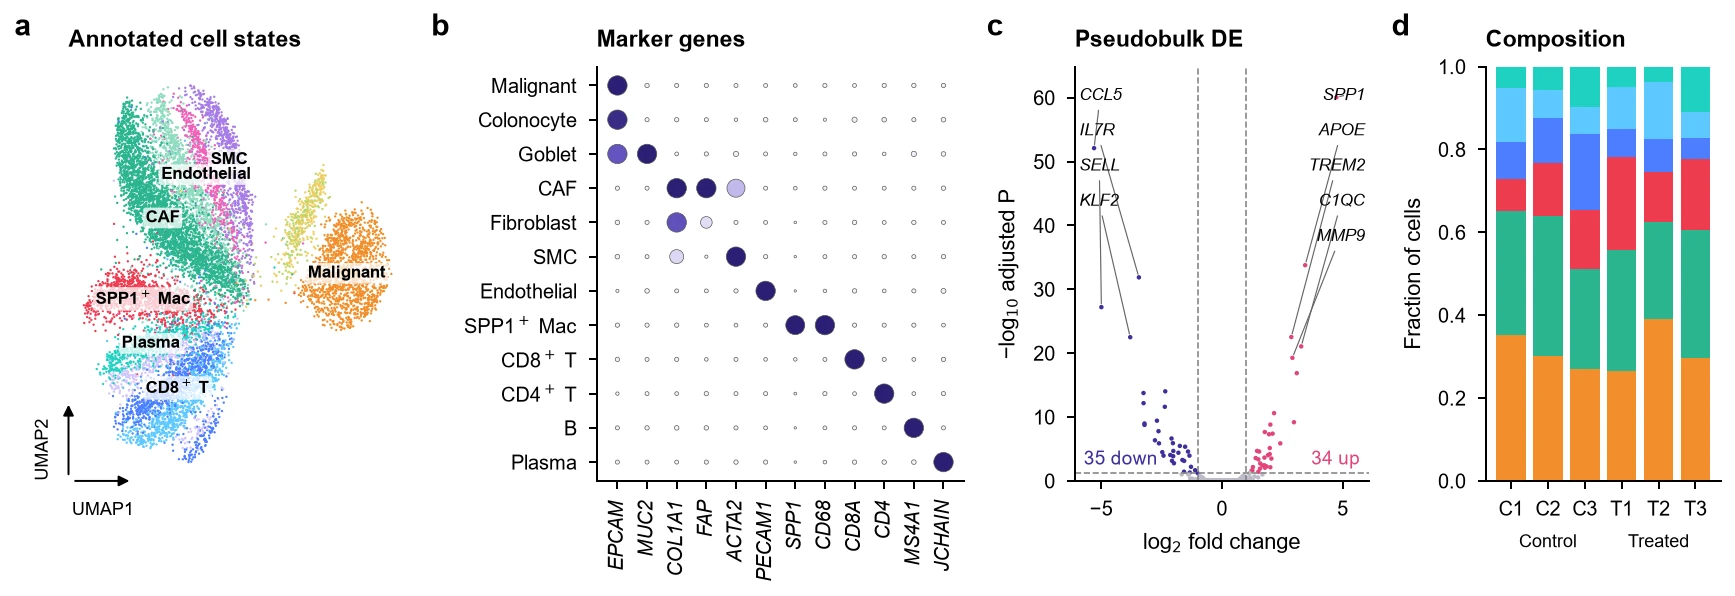
The kind of multi-panel figure we deliver, styled to journal specifications and revised until it is right.
Single-cell RNA-seq analysis: analyses we run
Every analysis below is available from raw data or from your processed files. Pick the ones your question needs; we recommend a robust core set during scoping.
Preprocessing and quality control
- Alignment and quantification
- Cell Ranger, STARsolo, alevin-fry or kallisto|bustools, with intronic reads for nuclei and multi-mapping handled correctly.
- Empty droplet calling
- EmptyDrops-style barcode ranking so low-RNA cell types (neutrophils, nuclei, quiescent cells) are not discarded.
- Ambient RNA correction
- CellBender or SoupX to remove background transcripts that create false marker expression.
- Doublet detection
- scDblFinder and DoubletFinder per sample, plus marker-based checks for heterotypic doublets.
- Adaptive QC thresholds
- Per-sample, MAD-based filtering on counts, genes and mitochondrial/ribosomal fraction instead of one global cutoff.
- Sample demultiplexing
- Cell hashing (HTO), CellPlex, MULTI-seq and genotype-based demultiplexing (souporcell, vireo).
Integration and clustering
- Normalization
- Shifted log, scran pooling or SCTransform, chosen for your design and downstream test.
- Batch correction and integration
- Harmony, scVI, scANVI, Seurat v5 or BBKNN, benchmarked with scIB metrics so biology is kept while batch is removed.
- Clustering at multiple resolutions
- Leiden clustering with stability analysis and cluster trees, so cluster count is a decision, not an accident.
- Reference mapping
- Azimuth, scArches and CellTypist label transfer onto published atlases (HCA, Tabula Sapiens, disease atlases).
Cell identity and states
- Expert cell-type annotation
- Marker-driven annotation reviewed by a cell biologist, with confidence levels and literature support for each label.
- Subclustering
- Iterative refinement of T cells, myeloid, stromal, neuronal or epithelial compartments.
- Gene program discovery
- NMF, cNMF and Hotspot gene modules for continuous states that clusters miss.
- Cell-cycle and stress scoring
- Phase assignment and dissociation-stress signatures, regressed only when that is appropriate.
- CNV inference
- inferCNV, CopyKAT or Numbat to separate malignant from normal cells in tumor samples.
Comparative statistics
- Pseudobulk differential expression
- DESeq2, edgeR or limma-voom on per-sample aggregates, which avoids pseudoreplication false positives.
- Mixed-model DE
- MAST or NEBULA with random effects for donor when cell-level modeling is justified.
- Differential abundance
- Milo, scCODA and propeller to test compositional shifts between conditions with proper uncertainty.
- Pathway and gene set analysis
- GSEA, fgsea, decoupleR, PROGENy and DoRothEA for pathway and transcription factor activity.
Dynamics, regulation and communication
- Trajectory and pseudotime
- Slingshot, PAGA, Monocle 3, Palantir and diffusion pseudotime, with trajectory robustness checks.
- RNA velocity and fate mapping
- scVelo dynamical models and CellRank, interpreted with known caveats about kinetics.
- Gene regulatory networks
- SCENIC/pySCENIC regulons and TF activity inference.
- Cell-cell communication
- LIANA consensus, CellChat, NicheNet and MultiNicheNet ligand-receptor analysis with condition contrasts.
Atlas and meta-analysis
- Public data integration
- Harmonize your data with GEO, CELLxGENE or HCA datasets to strengthen claims and add validation cohorts.
- Multi-study atlases
- Atlas building across labs, chemistries and tissues with harmonized metadata and annotation.
- Deconvolution references
- Build single-cell references for bulk or spatial deconvolution (MuSiC, BayesPrism, cell2location).
What you receive
- QC report with per-sample metrics, filtering decisions and a go/no-go recommendation
- Annotated objects (h5ad and Seurat RDS) and a CELLxGENE-ready file
- Publication-quality figures: UMAPs, dot plots, heatmaps, volcano plots, composition plots, trajectories
- Differential expression and pathway tables (Excel and CSV)
- Reproducible code (Nextflow, R Markdown or Jupyter) and software versions
- Methods section and figure legends ready to paste into your manuscript
Mistakes our experts avoid
- Treating cells as replicatesTesting thousands of cells from three mice as independent samples inflates significance by orders of magnitude. We aggregate to pseudobulk or model donor explicitly.
- Calling doublets a new cell typeHeterotypic doublets co-express markers of two lineages and are often reported as novel transitional states. We detect them computationally and check marker logic.
- Ignoring ambient RNAHighly expressed transcripts such as hemoglobin, immunoglobulins and tissue-specific secreted genes leak into every droplet. We correct for this before annotating.
- Over-correcting batch effectsAggressive integration can erase real condition differences. We benchmark integration and keep condition-specific biology visible.
- One global QC thresholdA fixed 10% mitochondrial cutoff removes metabolically active cell types and keeps damaged ones in other samples. We use per-sample, data-driven thresholds.
- Reading velocity arrows as proofRNA velocity assumes kinetics that many systems violate. We treat it as a hypothesis and confirm it with orthogonal evidence.
Tools and methods
We choose methods for your design, benchmark where it matters, and document versions for reproducibility.
- Cell Ranger
- STARsolo
- alevin-fry
- CellBender
- SoupX
- scDblFinder
- Scanpy
- Seurat v5
- scvi-tools
- Harmony
- CellTypist
- Azimuth
- DESeq2
- edgeR
- Milo
- scCODA
- LIANA
- CellChat
- pySCENIC
- scVelo
- CellRank
- inferCNV
How a project runs
Scoping call
Thirty minutes, free. We learn the biology, the design and the deadline.
Capped estimate
A written plan with hours, deliverables and a cap. No surprise invoices.
Secure transfer and QC
Encrypted transfer, then a QC report and a go/no-go call within days.
Analysis with check-ins
Weekly calls with your duo team and interim figures you can steer.
Figures, methods, code
Publication-quality figures, methods text and reproducible code. Revisions are unlimited.
Projects we rescued
Frequently asked questions
How much does single-cell RNA-seq analysis cost?
Analysis is billed at $79 per hour for standard work. A typical 4-8 sample 10x project (QC, integration, annotation, pseudobulk DE and figures) takes about 25-45 hours. Before we start, you get a written estimate with a cap, so the budget does not creep.
Can you start from FASTQ files or do you need count matrices?
Either works. We routinely start from BCL or FASTQ and run alignment ourselves, which lets us fix problems such as wrong chemistry, missing intronic reads or mis-assigned samples. We can also start from Cell Ranger outputs, h5ad or Seurat objects.
Do you analyze single-nucleus RNA-seq (snRNA-seq)?
Yes. Nuclei need intron-aware counting, stronger ambient RNA correction and adjusted QC metrics (mitochondrial fraction means something different). We handle frozen tissue, brain, heart, muscle, kidney and tumor biopsies routinely.
How many biological replicates do I need?
For condition comparisons we recommend at least 3, and preferably 4 or more, independent biological replicates per group, because the statistical unit is the donor or animal, not the cell. If your study has fewer, we tell you which claims it can support.
Can you re-analyze data that another provider or core already processed?
Yes. Rescuing and re-analyzing existing single-cell datasets is a large part of our work, often during peer review. We audit the previous analysis, explain what changed and why, and keep everything reproducible.
Do you sign NDAs and who owns the results?
We sign mutual NDAs before data transfer. You own all data, results, code and any intellectual property arising from the analysis.
Further reading
Send us your Single-cell RNA-seq data question.
Send a few lines about your experiment. A bioinformatician and a biologist will review it and reply with questions or a capped estimate. Analysis starts at $79/hour, and figure customization is unlimited.
- Free 30-minute scoping call
- Capped estimate before any billable work
- You own all data, code, figures and IP
Prefer email? contact@omicsquest.com