Cell Painting and single-cell phenomics analysis
Turn millions of cells and thousands of morphological features into hits, mechanisms of action and phenotypic fingerprints, with plate effects removed and replicates checked.
In short
OmicsQuest analyzes Cell Painting and other high-content imaging assays from raw images or feature tables. We run illumination correction and segmentation (CellProfiler, Cellpose), extract hand-crafted and deep-learning features (DINO-style or CellProfiler features), correct plate and well-position effects, normalize and select features with pycytominer, and score phenotypic activity, replicate reproducibility and mechanism-of-action similarity. Pricing starts at $79/hour.
Publication-quality figures
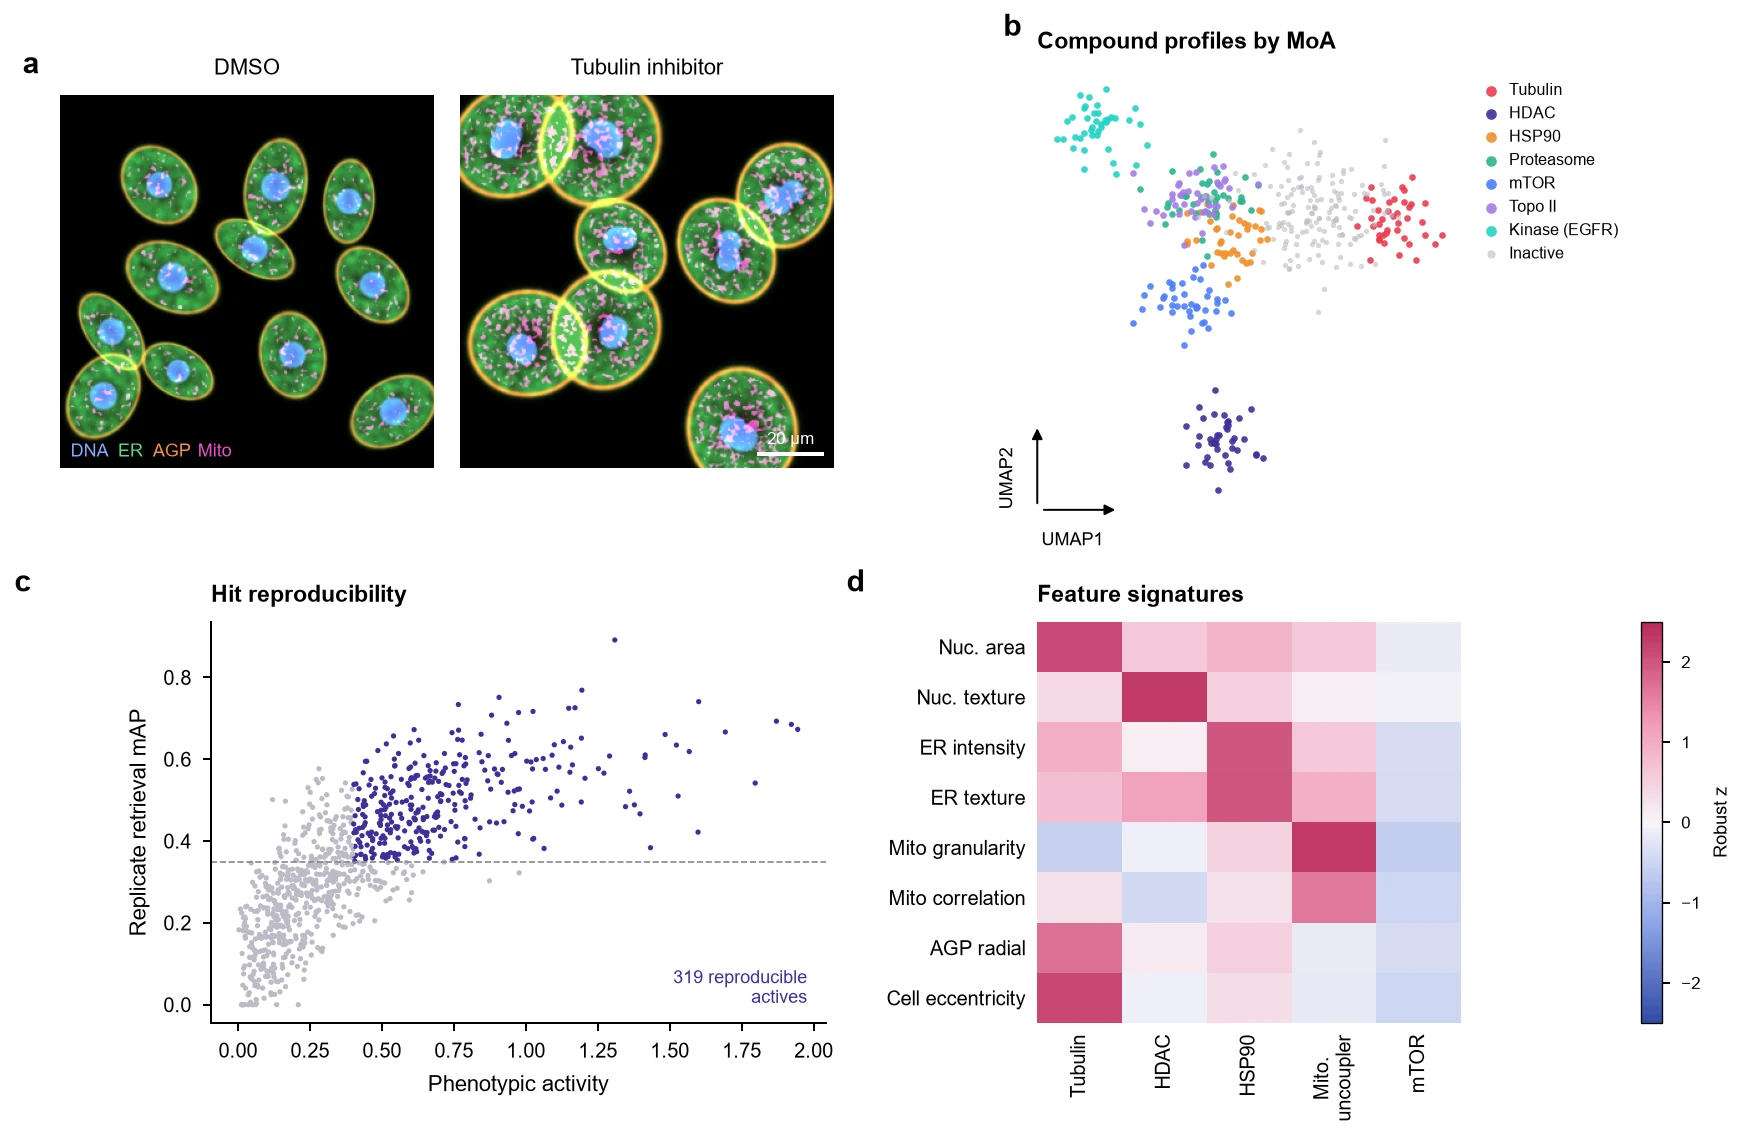
The kind of multi-panel figure we deliver, styled to journal specifications and revised until it is right.
Cell Painting and single-cell phenomics: analyses we run
Every analysis below is available from raw data or from your processed files. Pick the ones your question needs; we recommend a robust core set during scoping.
Image processing
- Image QC
- Focus, saturation and debris detection per field.
- Illumination correction
- Per-plate illumination functions.
- Segmentation
- CellProfiler and Cellpose for nuclei, cells and cytoplasm.
- Feature extraction
- CellProfiler morphology, intensity, texture and correlation features, plus self-supervised embeddings.
Profile processing
- Aggregation
- Single-cell to well-level profiles, with population-heterogeneity measures.
- Plate and position correction
- Robust normalization to negative controls and well-position correction.
- Batch correction
- Sphering and Harmony across plates and batches.
- Feature selection
- Variance, correlation and blocklist filtering (pycytominer).
Biological readouts
- Phenotypic activity
- Distance from controls with permutation-based significance.
- Replicate reproducibility
- Mean average precision (mAP) for replicate retrieval.
- Mechanism-of-action prediction
- Similarity to annotated reference compounds and genetic perturbations.
- Hit calling and clustering
- Hits, phenotypic clusters and representative cell images per cluster.
- Single-cell phenomics
- Subpopulation discovery and response heterogeneity at single-cell level.
- Multi-omic integration
- Link morphological profiles to transcriptomic signatures (L1000, RNA-seq).
What you receive
- Image and segmentation QC
- Normalized, feature-selected profiles
- Hit lists with mAP and activity scores
- MoA similarity maps and example images
- Code and methods
Mistakes our experts avoid
- Plate layout confounded with treatmentEdge wells evaporate and dry differently. If a compound always sits on the edge, its phenotype is partly position. We correct and flag confounded layouts.
- Normalizing to the whole plateNormalizing to all wells in a screen with many actives removes real signal. We normalize to negative controls.
- Ignoring cell count effectsToxic compounds change cell density, which changes morphology. We separate density effects from specific phenotypes.
- Reporting hits without replicate retrievalIf replicates of a compound cannot find each other, the profile is noise. We report mAP.
Tools and methods
We choose methods for your design, benchmark where it matters, and document versions for reproducibility.
- CellProfiler
- Cellpose
- pycytominer
- copairs
- DeepProfiler
- Harmony
- scikit-learn
- napari
How a project runs
Scoping call
Thirty minutes, free. We learn the biology, the design and the deadline.
Capped estimate
A written plan with hours, deliverables and a cap. No surprise invoices.
Secure transfer and QC
Encrypted transfer, then a QC report and a go/no-go call within days.
Analysis with check-ins
Weekly calls with your duo team and interim figures you can steer.
Figures, methods, code
Publication-quality figures, methods text and reproducible code. Revisions are unlimited.
Projects we rescued
Frequently asked questions
Can you analyze Cell Painting from raw images?
Yes. We run the full pipeline from raw images, including illumination correction, segmentation and feature extraction, on cloud compute sized to your screen.
Can you predict mechanism of action?
Yes. We compare profiles to annotated reference compounds, including public data such as the JUMP Cell Painting dataset, and report MoA similarity with confidence.
Do you handle non-Cell Painting high-content assays?
Yes: any multiplexed imaging assay, such as reporter assays, organoid imaging, neurite outgrowth and translocation assays.
Further reading
Send us your Cell Painting data question.
Send a few lines about your experiment. A bioinformatician and a biologist will review it and reply with questions or a capped estimate. Analysis starts at $79/hour, and figure customization is unlimited.
- Free 30-minute scoping call
- Capped estimate before any billable work
- You own all data, code, figures and IP
Prefer email? contact@omicsquest.com